
Expert Guide to Donut Graphs in PowerPoint
Creating presentations that make an impact often means using visual aids like charts and graphs to show complex data clearly.…
Read More

Definitive Guide to Combo Charts in PowerPoint
Combo charts are one of Excel’s most practical yet underutilized chart types. By combining column and line charts into one…
Read More

Easy Guide to Column Graphs in PowerPoint for Beginners
When visually presenting data, PowerPoint is one of the most influential and accessible tools available. One of the most common…
Read More

Effortless Guide to Bubble Diagrams in PowerPoint
Bubble diagrams are versatile visual thinking tools that use circles, or “bubbles,” to represent interconnected ideas, concepts, or data points.…
Read More

Beginner’s Guide to Box and Whisker Plots in PowerPoint
Data visualization plays an integral role in presenting complex information in a clear and accessible way. One powerful method of…
Read More

Ultimate Guide to Stacked Area Charts in PowerPoint
Stacked area charts are a powerful tool for visualizing data trends and composition over time. These versatile charts effectively communicate…
Read More

Simplifying Financial Data: Using Slope Graphs to Compare Key Business Metrics
In today’s data-driven business world, financial analysts and business leaders often find themselves awash in complex data sets and financial…
Read More
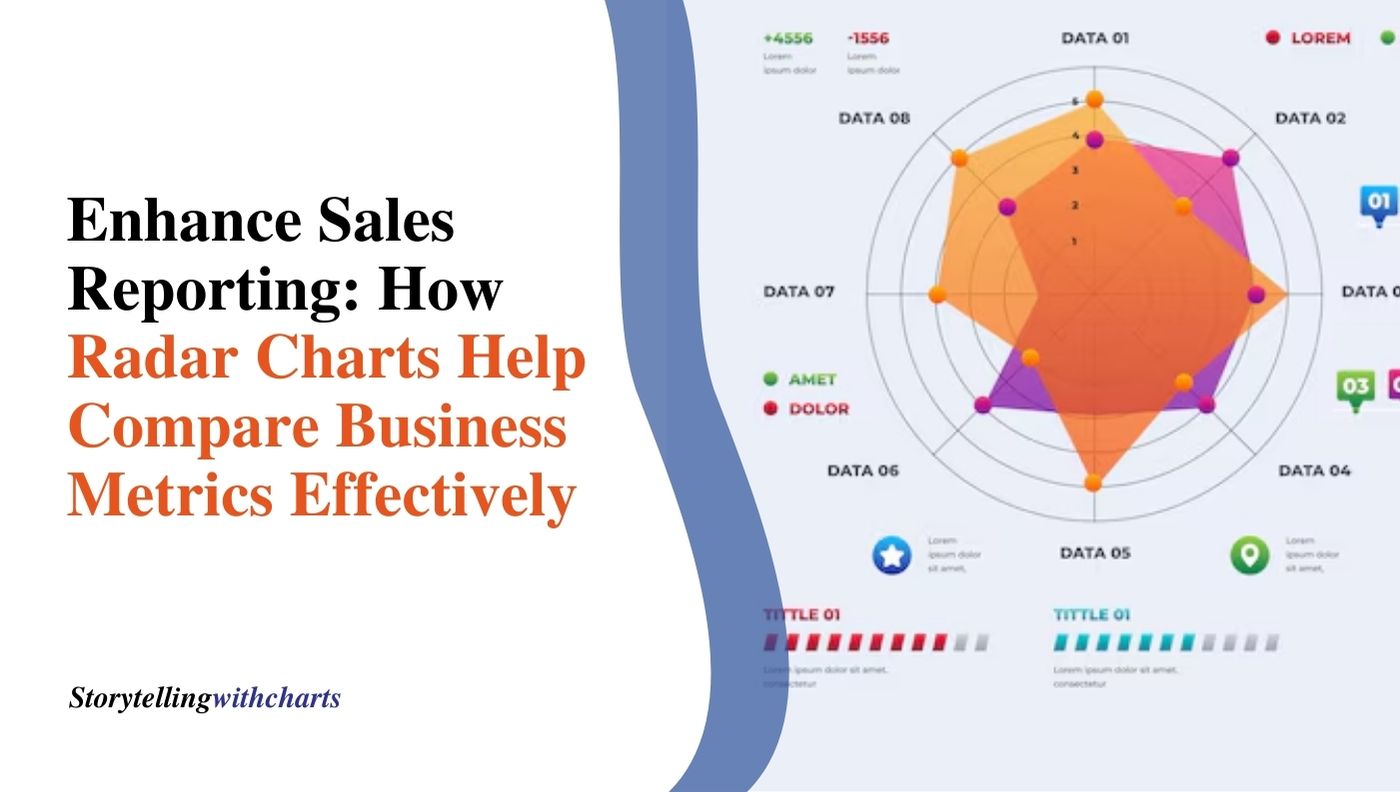
Enhance Sales Reporting: How Radar Charts Help Compare Business Metrics Effectively
Sales figures, conversion ratios, deal velocities, and other KPIs quantify the performance of your team. They indicate whether your sales…
Read More

What is a Waterfall Chart in Excel? Best Practices for Data Representation in Research, Marketing, and Sales
A waterfall chart is a type of data visualization in Excel that shows how positive or negative values contribute to…
Read More