Video Tutorials

Create Stunning Waffle-Pictogram Charts in PowerPoint in seconds
Learn how to create stunning pictogram waffle charts in PowerPoint in just seconds using the STCAI Plugin. This tutorial covers installation, customization, and design tips to make your data visuals stand out.

How to Create a Lollipop Chart in PowerPoint
This step-by-step tutorial shows you how to build engaging Lollipop Charts in PowerPoint with ease. Discover how to use our add-in, insert charts, and customize them to fit your data.
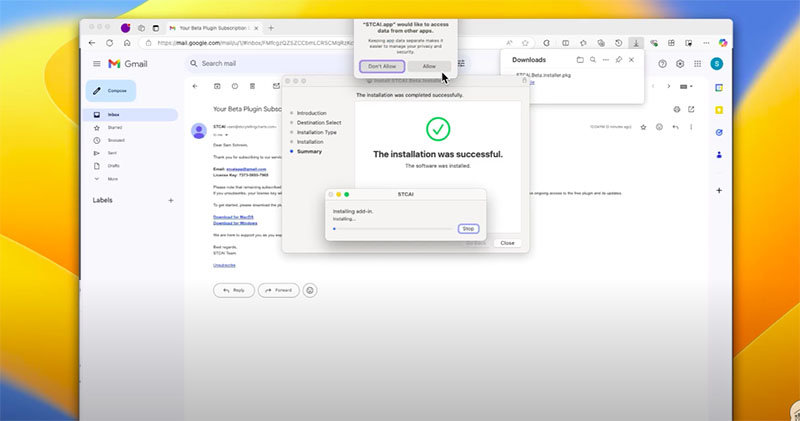
Step-by-Step Installation Guide: From Registration to Plugin Setup
Watch this detailed video tutorial to learn how to register on the website, download, and install the plugin on your computer. Follow each step to ensure a smooth setup process.