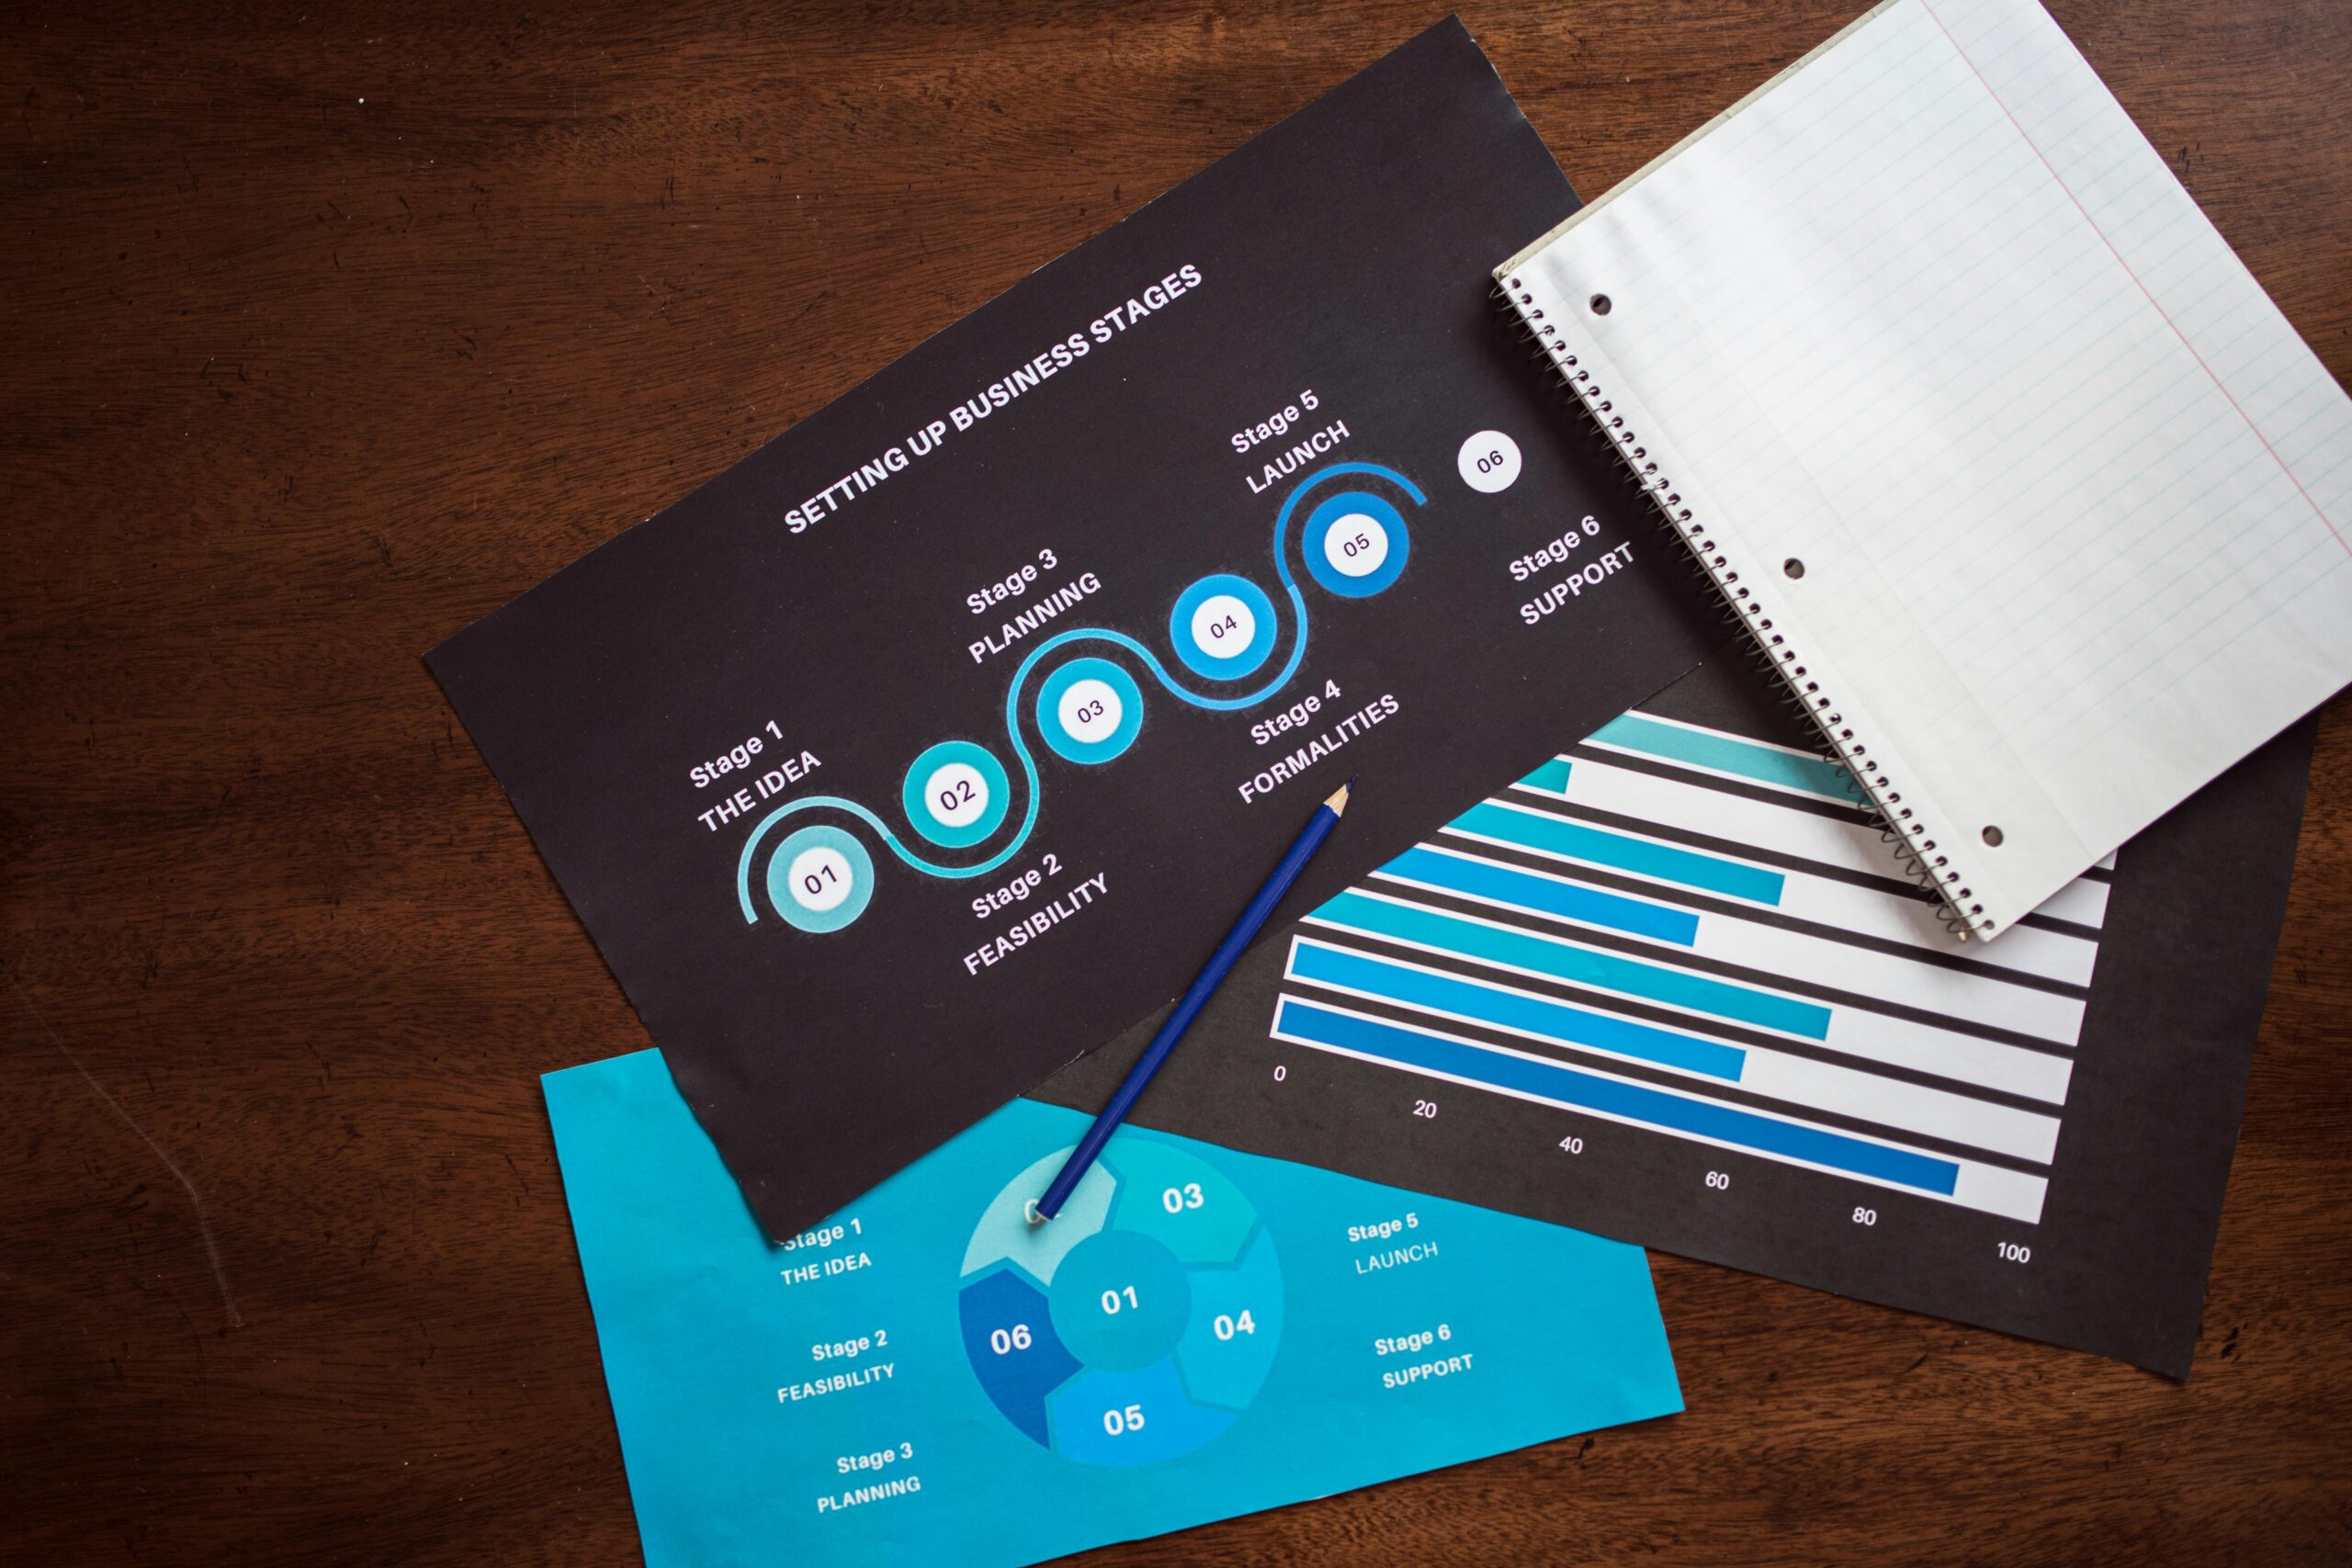
PowerPoint Chart Design Mastery: The Science Behind Effective Data Visualization
PowerPoint presentations are about far more than aesthetics. Sure, it helps if your presentation is attractive and looks the part,…
Read More
Flag Charts Unveiled: Mastering Data Anomalies
There are many different ways to display data, yet the flag chart remains one of the least used and, therefore,…
Read More
Box Chart Mastery: The Complete Guide to Visualizing Data Distributions
When we think about data visualization, we often consider bar charts, pie charts, and even scatter charts, but what about…
Read More
Bar Graph Mastery: The Complete Guide to Creating Powerful Data Visualizations
You have the information, you understand it well, but you need to present it to your audience so they have…
Read More
Mastering PowerPoint Infographics: Unleash Your Visual Storytelling Potential
PowerPoint presentations can be one of two things: extremely engaging and interesting, or downright boring. Of course, you don’t want…
Read More
Mastering Waterfall Charts: A Comprehensive Guide to Excel Templates and Data Visualization
Whenever you want to showcase data, it’s important to choose the right means. After all, making a mistake at this…
Read More
Data AnalysisData CommunicationData Storytelling TechniquesData VisualizationData Visualization SoftwareStorytelling with DataUncategorized
Pie Charts and Data Visualization: Communicating Insights with Impact
Pie charts and data visualization can feel overwhelming, especially when you’re tasked with turning raw data into a compelling story.…
Read More
The Future of Data Storytelling
Data storytelling today stands at a pivotal juncture, ripe with possibility. Though current practices enlighten many, rapidly evolving technologies promise…
Read More
How Data Storytelling Drives Results
Facts and figures spell snoozeville for most folks. But cleverly crafted narratives transforming data into engaging stories? Now you captivated…
Read More


