Become a Data Storytelling Pro: Lessons from Sam Schreim’s Book
Ever found yourself squinting at a report cluttered with numbers, scratching your head over how to transform it into something visually captivating? You’re certainly not the only one.
I was no different until I stumbled upon Sam Schreim’s enlightening book “Storytelling with Charts.” This blog post distills some of the key teachings from the book that promise to turn any dense data jungle into crisp, engaging narratives through charts.
So fasten your seatbelts and get ready for an exhilarating journey through the realm of data storytelling!
Key Takeaways
- Sam Schreim’s book, “Storytelling with Charts,” teaches readers how to effectively visualize data and create engaging narratives through charts.
- The book covers various types of charts, design principles, and the art of storytelling in data visualization.
- Readers will learn practical guidance on visualizing data, choosing the right chart types for different scenarios, using design principles for effective communication, and utilizing tools and templates for impactful presentations.
Who is Sam Schreim?
Sam Schreim is a top guy in the field of strategy. He gives smart advice to businesses. But, he is not only a consultant. Sam Schreim also put his thoughts into words and wrote a book! The title of this book? “Storytelling with Charts”.
It helps both pros and beginners in business. His goal was easy: make charts fun and cool for all! He did it by teaching readers how to make stories out of data. And guess what? His work is also available for people who love to listen, as an audiobook! So really, Sam Schreim is more than just a writer – he’s your guide into the exciting world of visual storytelling!
What is the book “Storytelling with Charts” about?
The book “Storytelling with Charts” by Sam Schreim is a comprehensive guide that teaches readers how to effectively visualize data and use various types of charts to tell engaging stories.
It covers the art of storytelling, design principles, and provides practical guidance on using tools and templates for creating impactful visual charts.
Visualizing data
Visualizing data is a key part of storytelling with charts. It involves turning numbers and information into visual representations that are easy to understand. In “Storytelling with Charts,” Sam Schreim provides practical guidance on how to create effective visualizations.
He covers different types of charts and the design principles behind them. The book also emphasizes the art of storytelling, showing readers how to use visuals to communicate their message effectively.
Whether you’re a professional or non-professional in business, this book will help you become a pro at visualizing data and telling compelling stories with it.
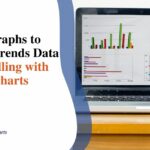
Types of charts
The book “Storytelling with Charts” covers different types of charts to help readers effectively present data. It explains how to choose the right chart for different scenarios and data sets.
The author provides practical guidance on using bar charts, line graphs, pie charts, and many more. By understanding the purpose and strengths of each chart type, readers can create visually appealing visualizations that enhance their storytelling.
Whether it’s comparing data or showing trends over time, this book teaches valuable skills in using various chart types for effective communication.
The art of storytelling
In “Storytelling with Charts,” Sam Schreim explores the art of storytelling and how it can be applied to data visualization. The book highlights the importance of combining logic-based analysis with compelling narratives in order to effectively communicate information.
By weaving data into a captivating story, readers can engage their audience and convey key insights more effectively. Schreim provides practical guidance on using visual charts to enhance storytelling, emphasizing the use of design principles for maximum impact.
Whether you are a professional or non-professional in business, this book will help you develop your storytelling skills and become a master at presenting data in an engaging and meaningful way.
Design principles
In “Storytelling with Charts,” Sam Schreim provides valuable insights into design principles for creating effective data visualizations. The book emphasizes the importance of clarity, simplicity, and consistency in designing charts and graphs.
It teaches readers to choose appropriate colors, fonts, and layouts that enhance the message being conveyed. By following these design principles, professionals and non-professionals can create visually appealing charts that effectively communicate their data stories.
With practical guidance and best practices, this book helps readers transform complex information into compelling narratives through visual storytelling techniques and chart design expertise.
Tools and templates
In “Storytelling with Charts,” Sam Schreim provides readers with practical tools and templates to enhance their data storytelling skills. The book offers a wide range of resources that can be used to create effective visual charts and presentations.
With these tools, professionals and non-professionals alike can easily interpret and communicate data in a compelling way. From design principles to different types of charts, the book covers all aspects needed for effective information presentation.
By using the provided tools and templates, readers can master the art of visual storytelling in no time.
Key Lessons from the Book
In “Storytelling with Charts,” I learned some key lessons that help me become a data storytelling pro. The book taught me the importance of visualizing data to make it more engaging and understandable.
It introduced different types of charts that can be used to present information effectively.
I also learned about the art of storytelling and how it can be applied to data visualization. By using storytelling techniques, I can create narratives around my data that capture the attention of my audience and convey clear messages.
The book provided practical guidance on chart design principles, such as choosing the right colors, fonts, and layouts. These design principles help me communicate my information in a visually appealing way.
Overall, “Storytelling with Charts” has equipped me with the necessary skills to master data storytelling. With its step-by-step tutorial and best practices, I feel confident in presenting my data in an impactful way that resonates with others.
Reviews and Feedback
I’ve read some reviews and feedback on “Storytelling with Charts” by Sam Schreim, and it’s clear that this book is highly regarded. Readers appreciate how the book combines data visualization with storytelling techniques to create powerful visual charts.
They find the guide to be user-friendly and practical, providing them with valuable insights into effective communication strategies for data interpretation. Professionals and non-professionals alike have found value in this book, as it offers step-by-step guidance and best practices for transforming data into compelling narratives.
Overall, “Storytelling with Charts” has received positive reviews for its ability to help readers improve their data storytelling skills and effectively present information through visuals.
Conclusion
In conclusion, “Storytelling with Charts” by Sam Schreim is a must-read for anyone who wants to become a data storytelling pro. With practical guidance and best practices, this book will teach you how to transform data into compelling visual charts and tell captivating stories.
Whether you’re a professional or just starting out, this guide will help you communicate your ideas effectively through data visualization and storytelling techniques. So grab a copy of the book and start mastering the art of data storytelling today!
FAQs
1. What is Sam Schreim’s book about?
Sam Schreim’s book is about using a logic-based approach to become a pro in data storytelling, aimed for non-professionals.
2. How does the book link business storytelling with data analysis?
The book combines business storytelling and data analysis to help you understand how effective data presentation can be achieved through narrative storytelling.
3. Does this book cover information design as part of Data Communication?
Yes, the lessons from Sam Schreim’s book include teaching on information design as an important part of data communication.
4. What is meant by “Data-Driven Storytelling”?
Data-Driven Storytelling means using real facts and figures from your own or others’ research to tell stories that make sense to your audience, a method well-highlighted in the book.